Engineering note
CPU LLM inference on two Xeon Gold 6230: a 2,372-row benchmark
No GPU, two sockets, 7,074 timed repetitions. We measured what actually moves CPU LLM inference: the runtime build, thread counts, NUMA placement, quantization, context depth, and serving concurrency. Here is what survived contact with the data.
We wanted to know what an existing CPU-only server could deliver before adding an accelerator. Before recommending a stack, we wanted defensible numbers on which model, runtime, thread count, and memory placement deliver usable decode speed on a plain dual-socket server.
This post summarizes a benchmark campaign run on October 4-7, 2026: 2,372 aggregate rows covering 1,233 attempted configurations, 1,219 of which completed cleanly, for 7,074 timed repetitions across 14 model-quant pairs (summed from the current aggregate, Qwen3.6 sweep included, unlike the earlier 6,138-sample tally). Synthetic token rates below are means of three timed repetitions from the campaign CSV. The separate serving experiment uses task-level wall timings and a different sample structure. The full dataset is public and linked at the end.
Hardware, definitions, and eras
The machine is a dual-socket Intel Xeon Gold 6230: 2 x 20 cores, 80 threads, two NUMA nodes, roughly 256 GB installed RAM of which 195 GiB is visible to the guest. It was a reported ~EUR 500 second-hand purchase, excluding TCO accounting. One caveat: each CPU has six memory channels but only four are populated (8 x 32 GB). More channels would add theoretical bandwidth parallelism; the gain is unmeasured, so we claim nothing.
Three definitions we use throughout:
- Decode is autoregressive generation speed in tokens per second (tok/s), measured by generating 128 tokens without a preceding prompt in the empty-context test. This is the number users feel.
- Prefill is prompt processing speed in tok/s on a separate 512-token prompt-processing test, without generated output. This dominates time-to-first-token for long prompts.
- Peak RSS is the resident memory footprint of the benchmark process. It is one input to capacity planning, not a complete serving budget: add KV cache, prompt cache, runtime buffers and concurrent requests.
One trap: the campaign spans two kernel eras on the Proxmox host. Early sweeps ran on kernel 7.0.2-6-pve (636 ok rows); all controlled comparisons and finals ran on 7.0.14-20-pve (1,722 ok rows), and every headline number below is from the current kernel. Qwen3.5-122B (9.84 tok/s) exists only in the earlier era and is not comparable across kernels, so it stays out of the ranking.
Methodology
All measurements use llama-bench from ik_llama.cpp and upstream llama.cpp, driven through numactl with explicit CPU and memory placement: node0/node1 (CPUs and memory on one socket), cross (CPUs split across sockets, memory interleaved), physical (workers permitted on the 40 physical cores, memory interleaved), and auto (no pinning, scheduler decides). Flash attention was active and weights were repacked in all final configurations; KV cache was f16 unless stated. Each configuration ran three repetitions and we report the mean. Error bars show the recorded standard deviations; three warm repetitions are still a small sample, not a guarantee of reproducibility on every workload.
The charts are built by the site from CSV-derived means with error bars, not hand-picked best-of-three samples. A per-model best is not a fully controlled causal comparison: thread count and placement differ between models. And each model was tested on the axes relevant to it, not a full Cartesian grid; the runtime and NUMA controls support matched comparisons; rankings and the other sweeps describe selected profiles rather than an architecture-only causal experiment.
What wins on CPU: sparse MoE, not parameter count
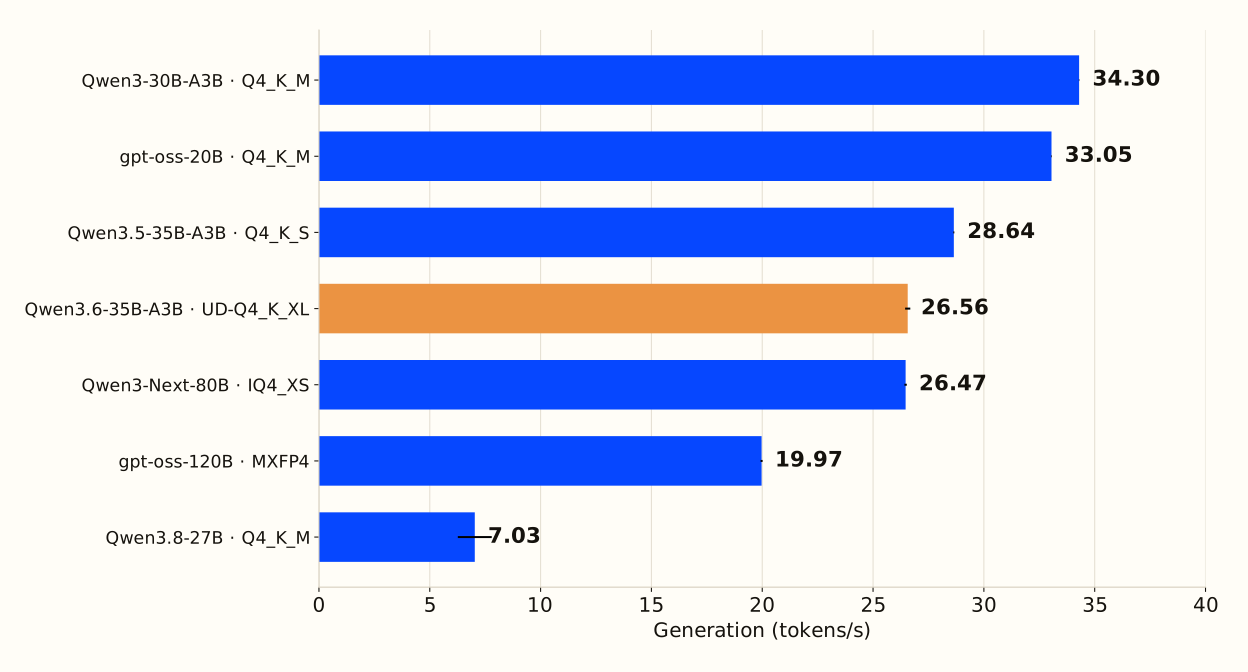
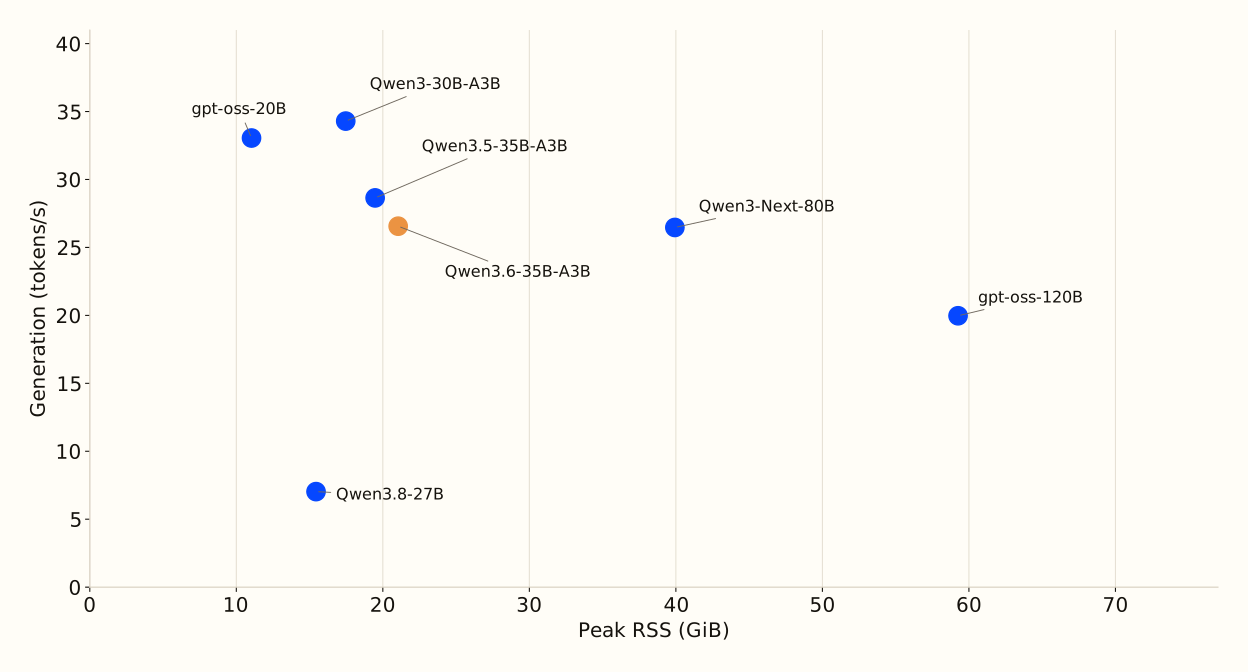
The ranking is unambiguous. Sparse mixture-of-experts models with small active parameter counts lead: Qwen3-30B-A3B Q4_K_M at 34.30 tok/s, gpt-oss-20b Q4_K_M at 33.05, gpt-oss-20b MXFP4 at 30.97, Qwen3.5-35B-A3B Q4_K_S at 28.64, Qwen3.6-35B-A3B UD-Q4_K_XL at 26.56, and Qwen3-Next-80B-A3B IQ4_XS at 26.47. The dense Qwen3.8-27B manages 7.03 tok/s. On CPU, where every active parameter costs memory bandwidth, the active-count-to-total ratio matters more than total size.
One scoping rule we enforce: the 80B is the fastest of the large models, not the fastest overall; Qwen3-30B-A3B beats it by roughly 30 percent.
The runtime is worth more than the hardware knobs
The single largest controllable factor we measured was the runtime build. We ran a matched phase on kernel 7.0.14-20-pve: same model file, same node1 placement, 16 threads, f16 KV, identical batch settings, ik_llama.cpp versus upstream llama.cpp at commit 0faee50.
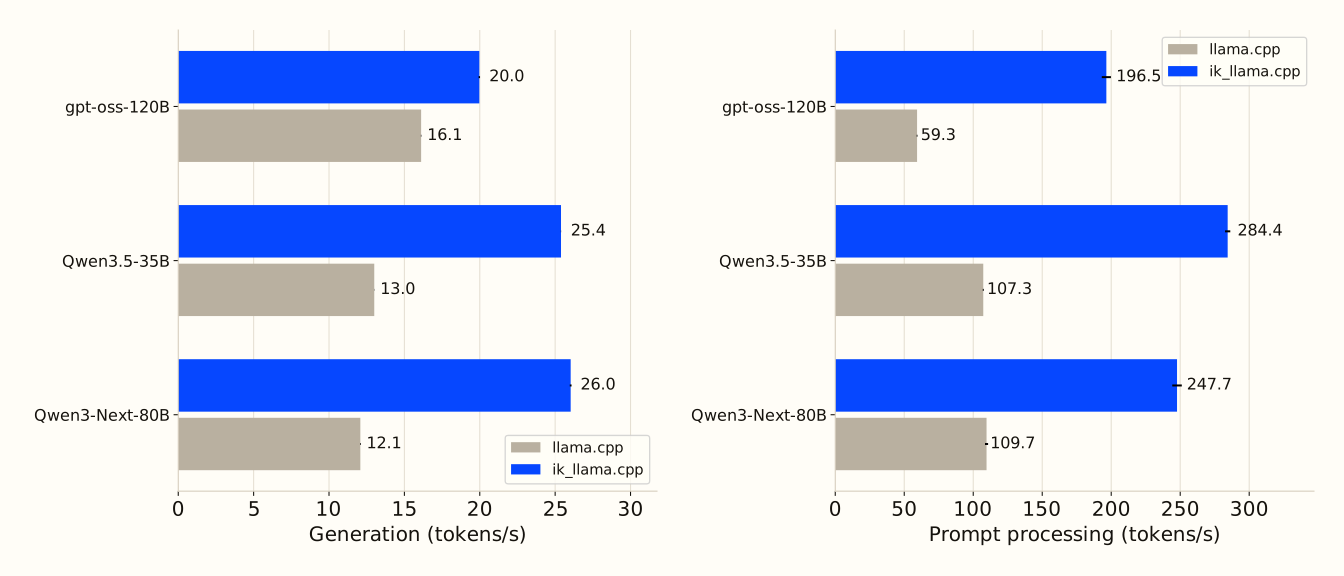
On Qwen3-Next-80B, ik decoded at 26.03 tok/s versus 12.08 upstream: 2.15x. Prefill was 247.70 versus 109.65: 2.26x. Qwen3.5-35B shows the same pattern (25.39 versus 13.00 decode, 1.95x; 284.39 versus 107.27 prefill, 2.65x). gpt-oss-120b gains less on decode (19.97 versus 16.11, 1.24x) but more on prefill (196.47 versus 59.30, 3.31x). These are the only cross-runtime numbers we present as A/B evidence, because they are the only ones where everything else was held constant.
Threads and NUMA: pin CPUs and memory together
Two experiments, one conclusion: default scheduler placement leaves a lot on the table.
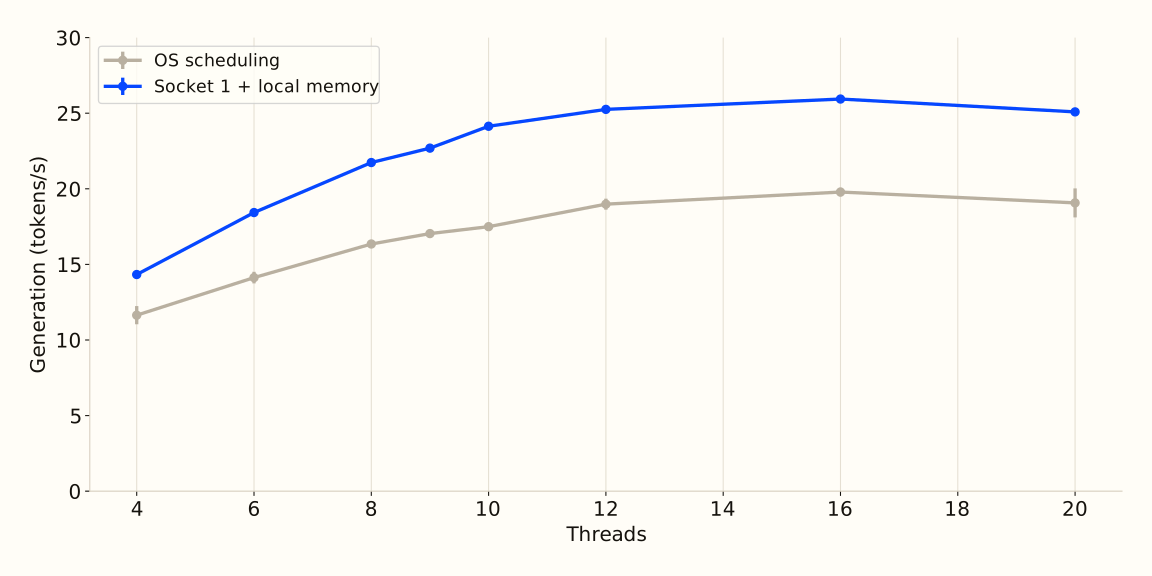
The thread experiment uses Qwen3-Next-80B on ik_llama.cpp, comparing pinned node1 placement against default auto placement at each thread count. Pinned decode climbs from 14.33 tok/s at 4 threads through 21.74 at 8 and 25.25 at 12 to a 25.94 peak at 16, then declines to 25.09 at 20; auto peaks at 19.78 at 16 threads. Two readings: past 16 threads additional logical cores buy nothing, and pinning versus default placement is worth roughly 30 percent at the same thread count (25.94 versus 19.78 at t16).
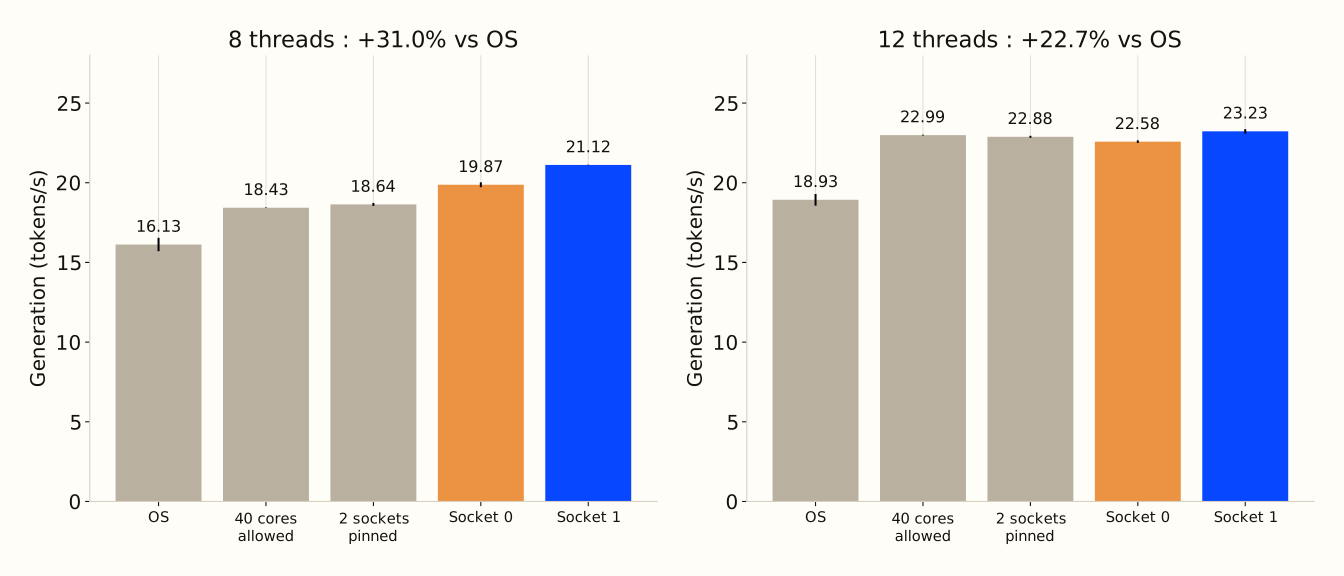
The NUMA experiment isolates placement on a smaller model: Qwen3.6-35B UD-Q4_K_XL on ik_llama.cpp, current kernel, placement swept at fixed thread counts. At 8 threads, default auto placement gave 16.13 tok/s; pinning 8 CPUs and memory to node1 gave 21.12, a 31 percent gain from a numactl flag. At 12 threads, auto gave 18.93 and node1 gave 23.23, up 22.7 percent. Splitting CPUs across sockets (cross) landed at 22.88 at 12 threads, close to but below node-local. The mechanism: decode streams the weights from RAM every token, so keeping the working set on the socket-attached memory controller matters as much as core count. These experiments changed CPU affinity and memory policy together. They do not establish how much CPU pinning alone would contribute.
Quantization: speed and footprint measured, quality not
We measured quantization strictly as a speed and memory tradeoff. This performance CSV does not measure quality loss between quantizations. The campaign’s API diagnostics do not establish a comprehensive model-quality or production-SRE verdict. Anyone telling you Q4_K_XL is “basically lossless” from this data alone is overstating it.
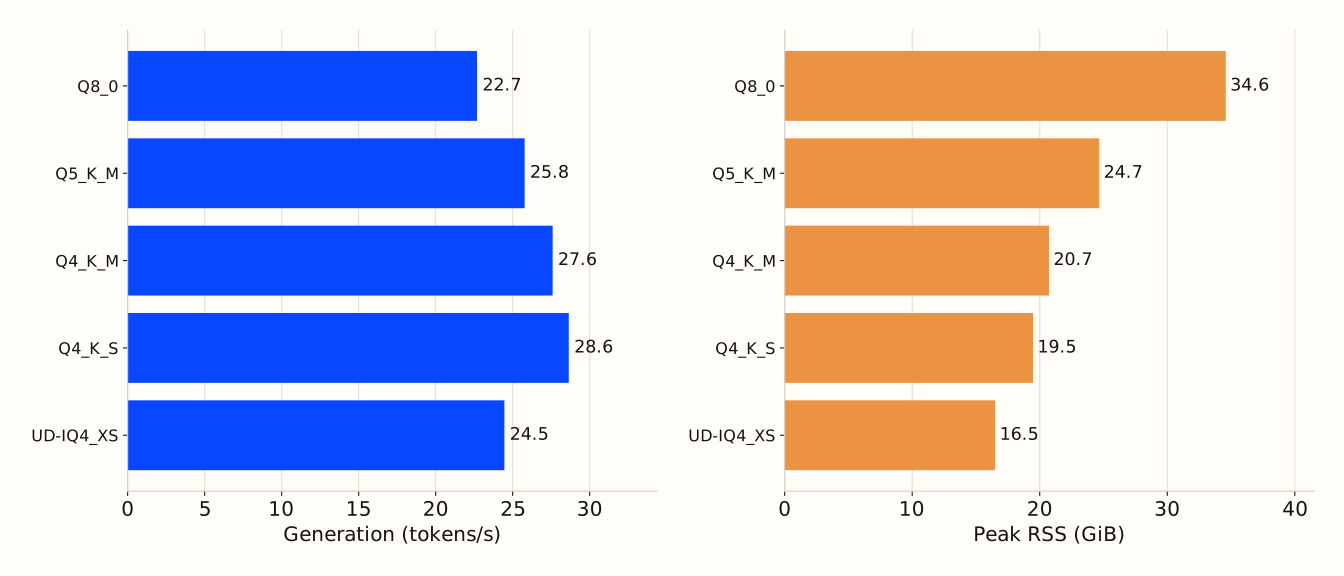
Among the best recorded Qwen3.5-35B profiles, the observed rates are: 28.64 for Q4_K_S, 27.60 for Q4_K_M, 25.78 for Q5_K_M, 22.68 for Q8_0, with the smaller UD-IQ4_XS at 24.46. Qwen3.6-35B UD-Q4_K_XL runs at 26.56 tok/s with a 21.0 GiB peak RSS; UD-Q5_K_XL runs at 25.39 tok/s with 25.0 GiB. On CPU, the quant choice is mostly a memory-budget decision with a modest speed kicker, not a dramatic performance lever.
The memory-versus-speed plot uses the same measured profile for each point’s throughput and peak RSS. Qwen3.6 approaches the 80B’s throughput with roughly half its benchmark RSS. This says nothing about equal answer quality. We have not reused the PDF’s Artificial Analysis scatter: several external pages describe reasoning variants that differ from our serving modes. External quality evaluations and local speed measurements need matching model variants before combining them.
Context depth and cache
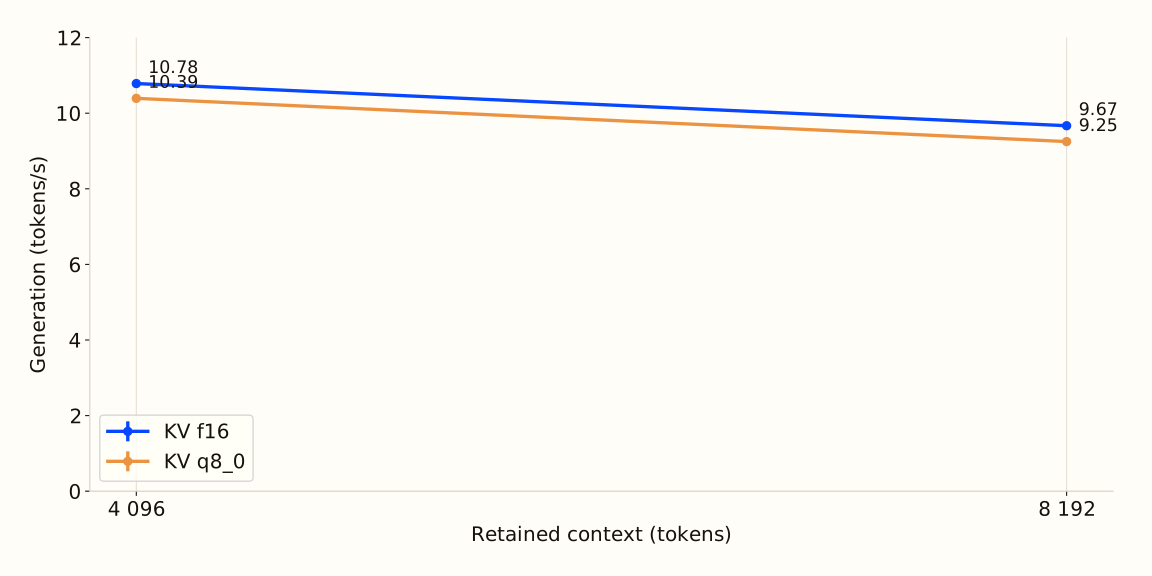
The context axis was carried by Qwen3.6-35B-A3B UD-Q4_K_XL on the upstream runtime, 8 threads pinned to node1, with mlock requested. Decode speed decays as context fills, and KV cache quantization taxes it further: with f16 KV, generating after a 4,096-token context ran at 10.78 tok/s, falling to 9.67 at 8,192; with q8_0 KV, 10.39 and 9.25 respectively. For context, empty-context decode in the separate batch sweep is 11.34 to 11.50 tok/s. That is a different phase, not a paired baseline. Within the retained-context controls, doubling depth from 4,096 to 8,192 tokens lowers f16 decode from 10.78 to 9.67 tok/s. Quantized KV adds a small throughput cost on this profile. Do not compare these upstream numbers with the 26.56 tok/s ik ranking figure: different runtime, 20 threads.
Prompt-prefix reuse and KV-cache quantization solve different problems. Prefix reuse can avoid processing text already seen; KV quantization changes memory used by the retained attention state. Neither should be treated as free acceleration of every request. The concurrency campaign below had a client clock bug that invalidated its TTFT measurements, so we publish no first-token latency claim from that dataset.
Batch and ubatch: mostly flat here
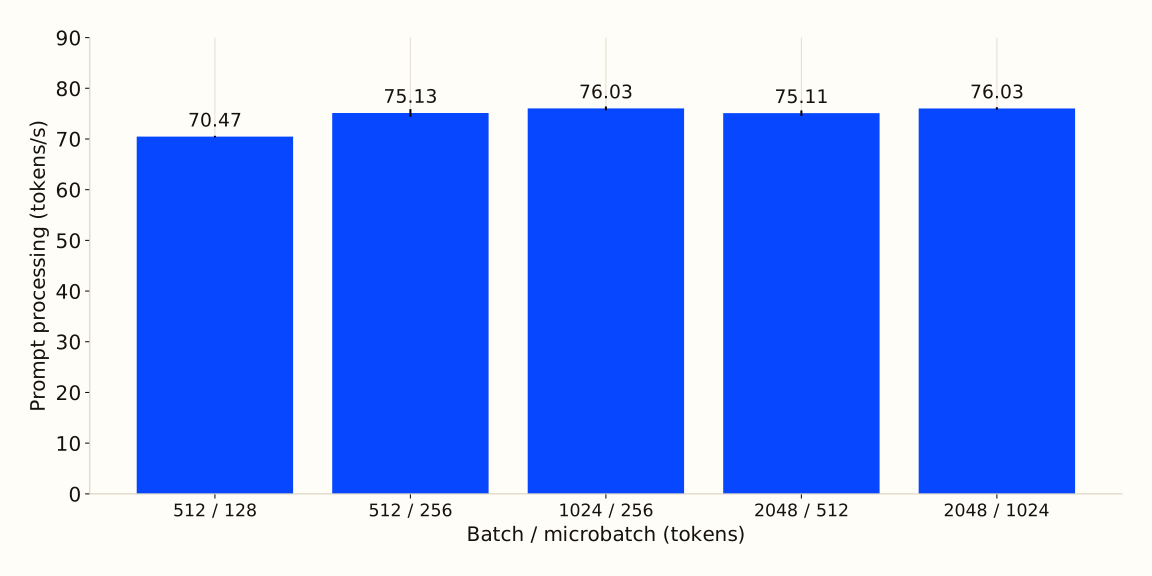
The batch axis was carried by the same Qwen3.6 configuration (upstream, 8 threads, node1, mlock requested): prompt processing at 512 tokens across batch 512 to 2048 and ubatch 128 to 1024. Prefill moved from 70.47 tok/s at b512/ub128 to a band of 75.1 to 76.0 for every larger combination, and decode held flat at 11.34 to 11.50. At these prompt sizes there is nothing to tune once past the smallest ubatch; batch matters for real concurrent serving, the next section.
Serving concurrency: two clients work, four degrade
The serving experiment requires the most care about what it is not: it is not an isolated one-server-versus-two A/B. We loaded two resident replicas of Qwen3-Next-80B IQ4_XS, one per NUMA node (16 threads each, node-local binding), and drove a mixed task load at client concurrency C=1, 2, and 4. Outputs were not matched across levels and samples are small, so read it as a scaling probe, not a controlled benchmark.
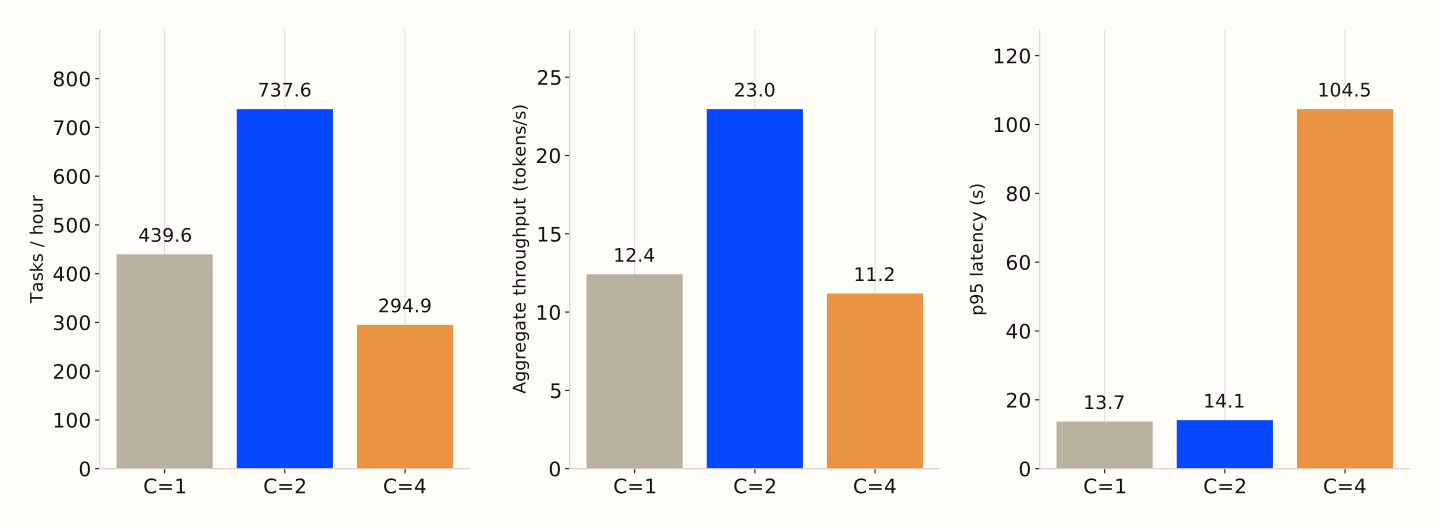
The results: C=1 completed 6 tasks at 440 tasks/h, 12.4 tok/s aggregate, p95 latency 13.7 s. C=2 completed 12 tasks at 738 tasks/h, 23.0 tok/s aggregate, p95 14.1 s. C=4 collapsed: 295 tasks/h, 11.2 tok/s aggregate, p95 104.5 s. With both replicas absorbing one request each, throughput gained 68 percent at essentially unchanged tail latency. Two requests per replica made everything worse: aggregate throughput fell below single-stream level and tail latency grew sevenfold. The collapse is consistent with local memory-bandwidth contention on each socket, but we did not instrument bandwidth, so that mechanism stays a hypothesis. The takeaway stands regardless: one in-flight request per NUMA-local replica is the sweet spot; oversubscribing it is counterproductive.
Launcher and API quirks we hit
Field notes that cost us time. FastLLM’s import/dependency path failed before producing valid timed runs, hence two benchmarked runtimes instead of three. That does not establish a general GGUF incompatibility. The two llama.cpp forks use different flags for the same concepts (-fa 1, -rtr 1, -mmp 0 on the ik side; --repack, --poll, -lm upstream), so cross-runtime commands must be built carefully or you silently benchmark different settings. Loading policy affects residency and locality. In an unprivileged LXC, a requested mlock is not proof that pages were locked. Also verify CLI flags against the installed binary: our current upstream server uses --load-mode none, while the ik launcher accepts --no-mmap. And reasoning-mode defaults differ between families and serving modes; verify the same variant, not just the same model name.
What we recommend, separately from what we measured
A deliberate separation: everything above was measured under specific scenarios (per-model axes, single benchmark process, isolated host). The choices below are architecture recommendations built on those measurements plus capacity arithmetic, not end-to-end benchmarks themselves.
Our practical default is Qwen3.6-35B-A3B UD-Q4_K_XL: 26.56 tok/s decode at 20 threads, 21 GiB peak benchmark RSS. Two replicas look feasible from that starting point, but we did not run the dual-replica test with Qwen3.6: actual node-local free memory and served KV/cache usage still need verification. We state plainly that this is a capacity and speed default, not an objective quality verdict: we measured no quality metrics, and the 122B-class models were not comparable across kernel eras. Qwen3-Next-80B is the model we actually tested as two NUMA-local replicas. Its 26.47 tok/s single-process benchmark and roughly 40 GiB benchmark RSS are useful sizing inputs, not proof it gives better answers than Qwen3.6 or that a larger model is always preferable.
Data and reproduction
The full dataset is public:
- Aggregate CSV: /data/cpu-llm-study-2026/benchmarks.csv
- Concurrency data: /data/cpu-llm-study-2026/concurrency.csv
- Chart data and notes: /data/cpu-llm-study-2026/chart-data.json , /data/cpu-llm-study-2026/README.md
Every row carries a config_id to reproduce or audit a specific claim. A few from this post: the Qwen3-30B ranking leader is 70675e19e778a871ca, the matched 80B runtime pair is 9d81c9b3c2baf30747 (ik) versus be09e70fc78ec3a8db (upstream), the t8 node1 NUMA result is 118bdf5e97e918b6c3 (the t12 result is ed060c8dcbfd608922). Each row records the exact command; the shape of a pinned run:
numactl --physcpubind=<node-cpus> --membind=<node> \
  /path/to/llama-bench -m /path/to/model.gguf \
  -t 16 -p 512 -n 128 -r 3 -ngl 0 -b 2048 -ub 512 \
  -o json -mmp 0 -ctk f16 -ctv f16 -rtr 1
If you are sizing CPU-only inference for on-prem workloads and want this kind of measurement on your hardware, that is work we do. Get in touch.